Tuesday, September 15, 2026Independent, original journalismSome links are advertising or affiliate links. How we make money
Independent reviews, guides and reporting.
★0saved articles
Finance
Explainer
How to read an inflation report without the noise
A monthly price release contains one number everybody quotes and several that actually explain what is happening. Here is the order in which to read them.
By THRYV Money Desk·Published July 20, 2026·Updated July 28, 2026·6 min read
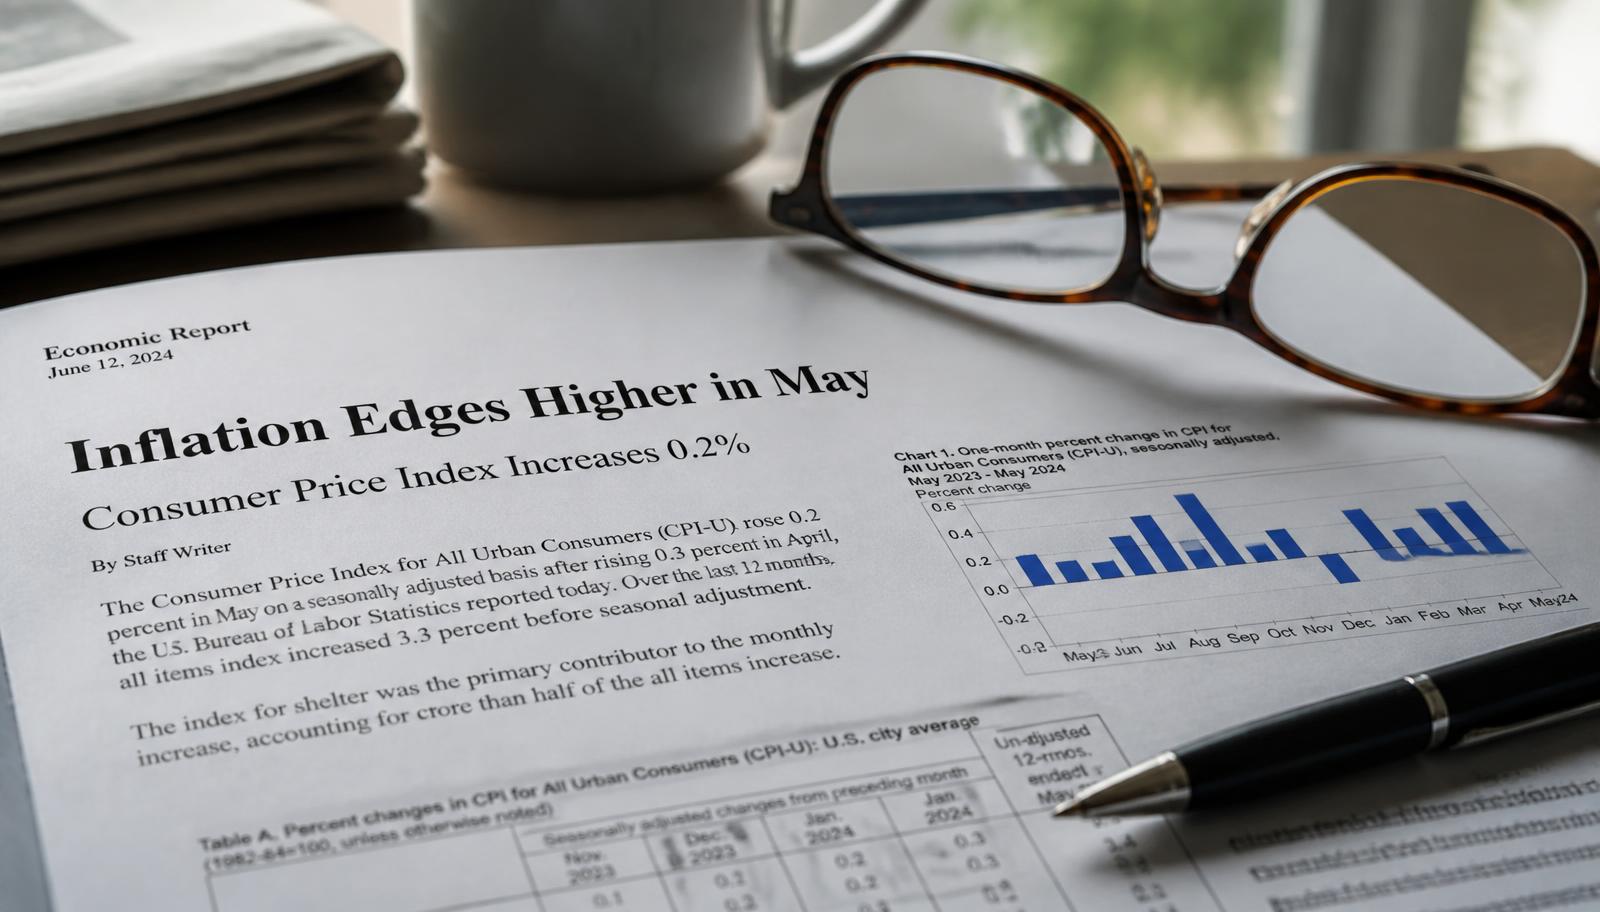
Finance · Illustration commissioned for THRYV. Photography is replaced with original imagery as each story is produced.
The takeaway
Read an inflation release from the inside out: start with month-over-month change, then core, then the shelter and services components, and only then the headline year-over-year figure. Annual numbers carry twelve months of history, so they lag turning points. Revisions and seasonal adjustment matter more than most coverage admits.
An inflation release is a large, carefully documented statistical product that gets compressed into a single percentage before most people see it. The compression is not dishonest, but it discards the parts that tell you where prices are heading rather than where they have been.
Start with the monthly change, not the annual one
A year-over-year figure compares this month with the same month twelve months ago, which means it embeds a full year of accumulated price changes. When conditions turn, the annual number keeps reflecting old months that have not yet rolled out of the window. The month-over-month change — and the three-month annualised rate, which smooths single-month noise without importing a year of history — reacts far sooner.
Base effects, plainly
If prices jumped sharply a year ago, the annual rate can fall this month even when prices are rising normally right now. That is arithmetic about the comparison month, not evidence that inflation is cooling.
Then look at core, and understand why
Core measures exclude food and energy. The reason is not that groceries and fuel are unimportant — they dominate household experience — but that their prices are volatile and driven by supply shocks that reverse. Core is a signal-extraction tool for the underlying trend, not a claim about your cost of living. Both readings are legitimate; they answer different questions.
Then the components that carry weight
Shelter: the single largest component in the US consumer basket, measured with methods that lag observed market rents by many months. A shelter figure often describes the rental market of last year.
Services excluding shelter: closely watched as a proxy for domestically generated, wage-sensitive price pressure.
Goods: more exposed to supply chains, freight costs and currency moves, and more prone to sharp reversals.
Energy: the main source of headline volatility, and the reason headline and core can diverge for months.
An annual inflation figure carries twelve months of history. It is the slowest possible way to notice that something has changed.
THRYV Money Desk
Read the footnotes people skip
Seasonal adjustment. Most reported figures are seasonally adjusted; the unadjusted series can tell a visibly different short-run story.
Revisions. Seasonal factors and source data are updated, so a month you already reacted to can change afterwards.
Methodology notes. Weights are periodically re-based to reflect changing spending patterns, which shifts how much any component contributes.
Which index it is. CPI and PCE differ in scope, weighting and substitution treatment; policymakers and headlines do not always cite the same one.
A practical reading order
Open the release itself rather than the coverage. Read the monthly core change, then the three-month annualised trend, then shelter and core services, then the annual headline as context. That sequence takes a few minutes and produces a more stable view than any single quoted number — particularly around turning points, which is exactly when the headline figure is least informative.
No specific values are quoted in this explainer on purpose. Data is revised and released monthly; use the primary releases linked below for current figures.
Sources
This article is original writing by THRYV. We link to primary reporting and official documents rather than reproducing them.
Written and edited in-house by the THRYV Money Desk. We do not republish or reword agency copy, and we do not invent quotes, statistics, testimonials or ratings. Where figures move frequently, we point you to the primary release rather than printing a number that will be out of date. Advertising and affiliate partnerships have no influence on our reporting — see our editorial standards, fact-checking policy and affiliate disclosure. Spotted an error? Write to newsroom@thryv-news.com.
General information only. Not personalised financial, medical or legal advice.
The headline number moves in a single afternoon. The money in your accounts moves on a much slower, more uneven schedule — and understanding the lag is most of the advantage.